GRC 404
Data Portfolio
My name is Madeline Wales and I am a Graphic Communication student at Cal Poly, San Luis Obispo.
This data portfolio is designed to show you the work I have completed in my GRC 404 (Data Management, Estimating and Visualization in Graphic Communication) class at Cal Poly.
To download the Excel files, click on the screenshots.

Basic Excel
This simple spreadsheet demonstrates fundamental concepts from weeks 1 and 2, including:
-
Data Validation (Menus): the ability to limit values that can be entered into a field, in this case limited to a list.
-
Name ranges: referring to a block of cells by a single name
-
Iferror Error Handling: providing meaningful feedback to users when values entered result in an error.
Data Cleaning
This spreadsheet, developed from a 4000 record CSV file, demonstrates some techniques and the challenges associated with cleaning data. Using data generated from the Faker Python library, the data had to be cleaned. Techniques used include:
-
Using Text to Columns to separate items such as first and last names in to separate columns.
-
SUBSTITUTE to switch a line break to a semi colon to make Text to Columns easier to use with addresses
-
TRIM when deleting honorifics and credentials from names.
Lookup Tables in Cost Estimating
This spreadsheet is used for estimating book graphic design from tables published in Graphic Arts Guild Handbook of Pricing and Ethical Guidelines 12th Ed.
-
VLOOKUP to match hourly rates to job functions.
-
MATCH correct row name to column name in a look-up table.
-
Conditional Formatting to inform the user of any errors, blank spaces, etc.)
-
NOT(ISNUMBER... and other conditional statements were used for error handling.
Tableau Dashboard — San Jose Sharks
This Tableau Dashboard displays the winning record of the San Jose Sharks from 2008 to 2020. There are 2 different graphs on the dashboard with 6 different worksheets in the file.
-
Bar graph, area graph, treemap, and line graph of goals for versus goals against in each season.
-
Calculating win ratio using a function
-
Scatter plot with trend line for shots on goal versus goals made.
-
Filtering data on the dashboard by season.
Contextual Menus in Excel
This spreadsheet from weeks 2 and 3 demonstrates the following concepts:
-
Contextual menus using INDEX; the menu in column C contains values that are dependent on the value from column b.
-
Conditional Formatting: the appearance of the cell changes based on a logic test. Red cells are debits and Green cells are credits.
VLookups
This spreadsheet focuses on data lookups in the context of ink cost estimating. Specifically, this spreadsheet demonstrates the challenges of using Vlookups in the context of variable rows and columns.
-
VLOOKUP to determine ink mileage based on ink and paper used.
-
Nested MATCH statements for lookup tables with named columns and/or rows.
-
Naming Table Arrays, Lookup Arrays and Menus for drop down menus and lookup functions.
Tableau Dashboard — High School Zip Codes, ACT Scores, AP Classes, & GPA
This Tableau Dashboard displays the high school zip code of students who have taken this survey and compares their high school GPAs to their ACT scores and the number of AP classes they took in high school.
-
Excluding null/random data
-
Manual sorting
-
Filtering by specific data
Pivot Dashboard — Pivot Tables &
Pivot Charts
This Dashboard was developed using data from a survey given to students who take GRC 404.
-
Pivot Table to compare favourite Spongebob character to GRC concentration
-
Pivot Table to compare high school GPA to number of AP classes to GRC concentration
-
Pivot Chart comparing favourite social media based on whether you use Mac or Windows
Tableau Analysis of San Diego
Airbnb pricing
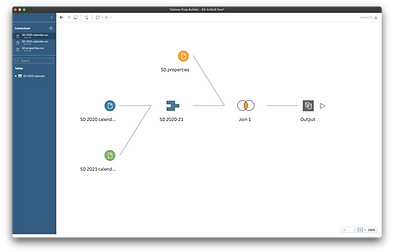
This Tableau file provides several samples of sophisticated visualizations including:
-
Cluster mapping
-
Geomapping using distance from the San Diego Zoo (miles)
-
Line graph of average price per week with image background
-
Treemap of average price by neighbourhood
-
Bar graph of average price by number of bedrooms
-
Tableau story of multiple graphs on two pages


